Where is your fleet losing time?

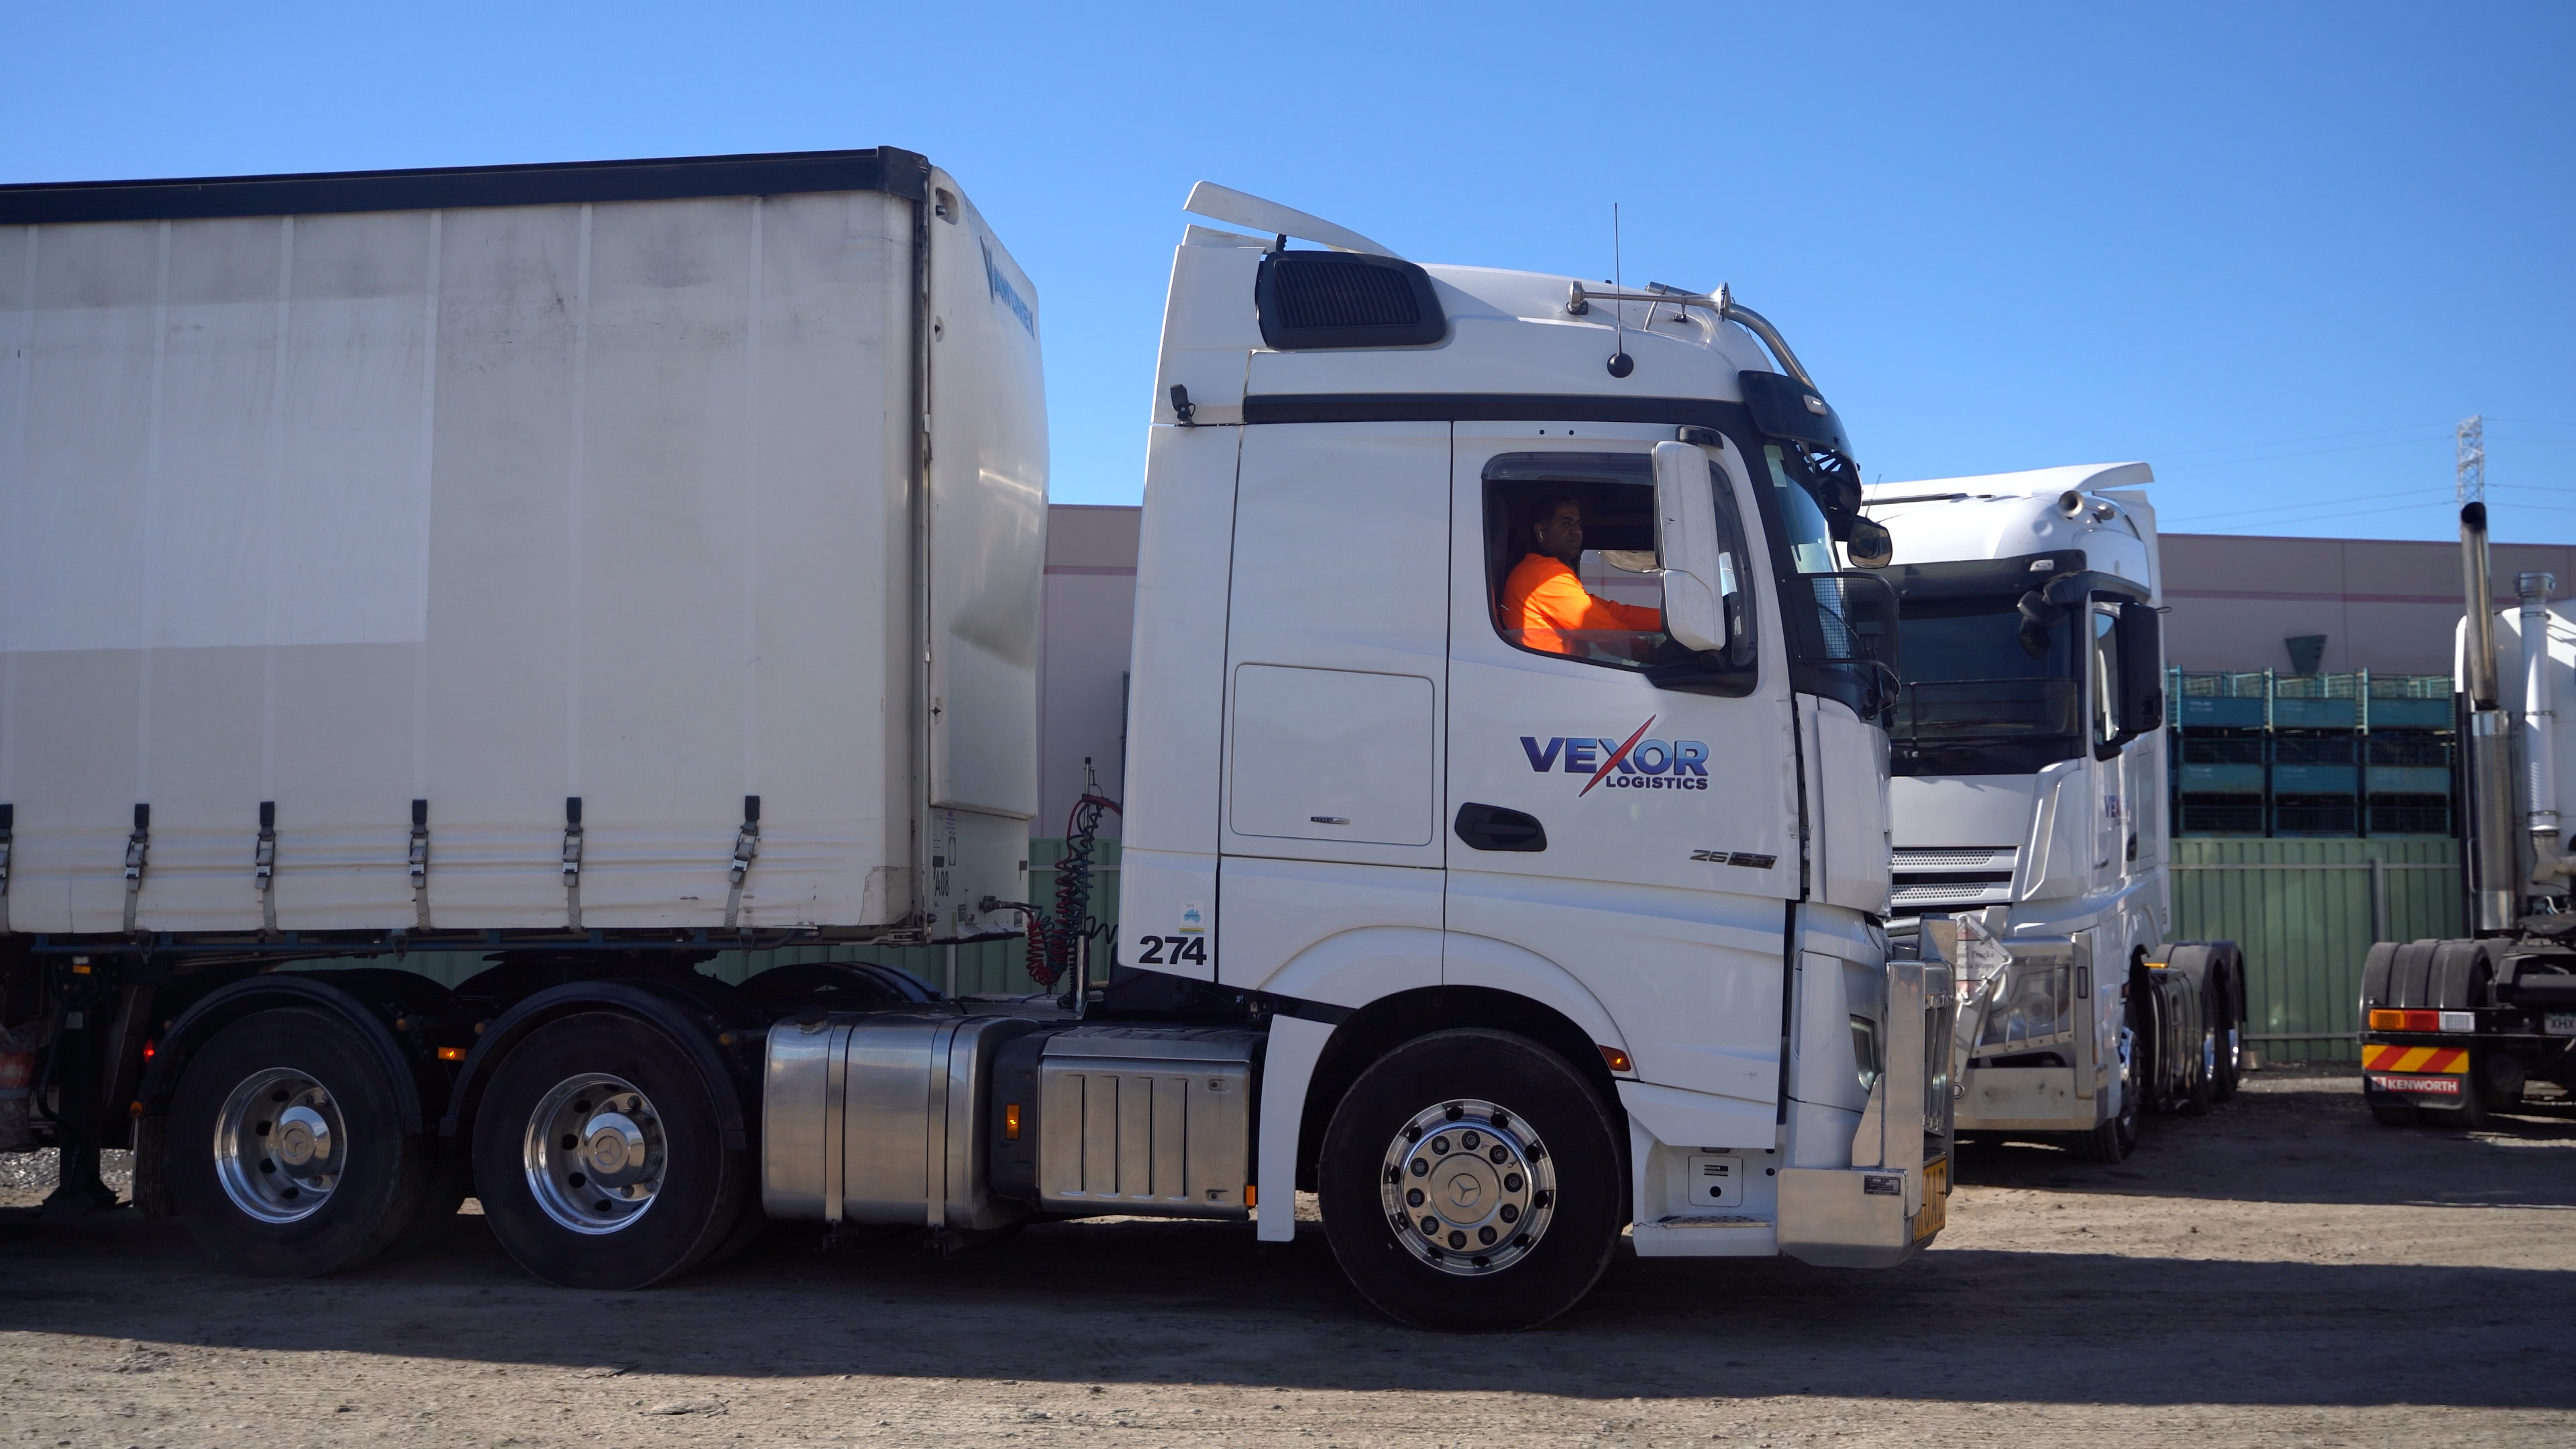
For transport operators, lost time often happens after the truck arrives: waiting to load at a distribution centre, held up at a delivery dock or sitting longer than planned at a customer site.
Overtime, those delays add up.
Geofence reports help operators see where vehicles are spending time, how long they remain at different locations and whether the same patterns keep appearing.
V-DAQ's Geofence Activity Report brings that information together in one place, turning everyday tracking data into useful insights about turnaround times, delay queries and site activity.
Unlike geofences that need to be set up in advance, V-DAQ's cloud-based geofences can be applied to historical tracking data. That means you can investigate previous site activity, even if a geofence wasn't in place at the time.
Key takeaways
Time on site is where delays hide. Minutes spent at depots, distribution centres and customer sites add up across a fleet and affect scheduling, productivity and operating costs.
Geofence data replaces guesswork. Entry and exit times give a consistent record, rather than relying on driver recollections, phone calls or handwritten arrival times.
It supports demurrage conversations, it doesn't decide them. Geofence records show how long a vehicle was on site; whether a charge applies is still a commercial agreement.
You can investigate past activity without planning ahead. V-DAQ's cloud-based geofences let you review historical site visits, even when a geofence wasn't previously configured.
Patterns matter more than single visits. Historical activity shows which sites regularly hold vehicles longer than expected.
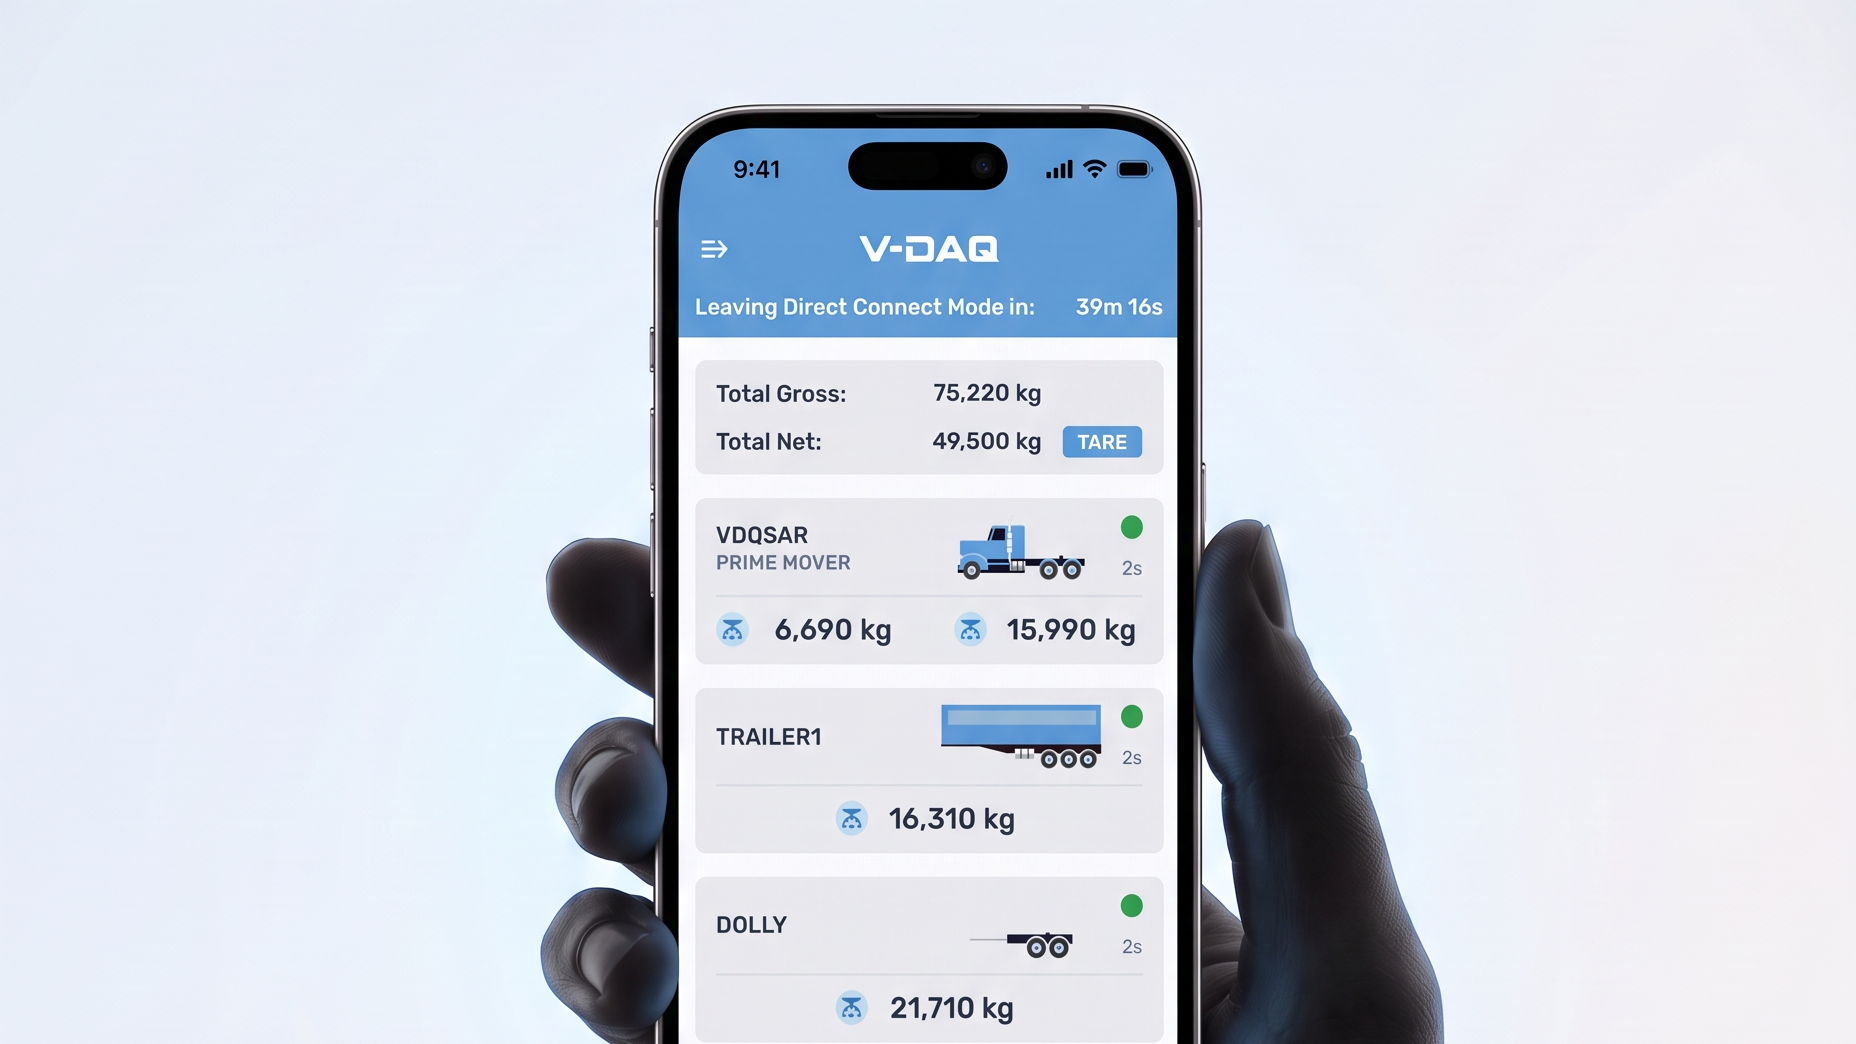
V-DAQ's Geofence Activity Report combines entry and exit events, time on site, stop and idle time and maximum speed within a geofence, with payload context for supported Smart OBM configurations.
Why does time on site matter?
Time on site matters because a delay at one site flows into the rest of the day. A truck can arrive on schedule and still lose an hour waiting to load. Another might be held at a delivery dock. Over time, those delays affect how many jobs you can complete, how drivers' hours are used and what each trip really costs.
The challenge usually isn't knowing that a delay happened. It's having the information to understand where, when and how often. Arrival and departure times, time spent stopped and the frequency of visits each tell part of that story. Seen together, they make it easier to identify patterns, investigate delays and have better informed conversations with customers.
Here are five practical ways operators can put that information to work.
1. How can a geofence report improve turnaround times?
A geofence report improves turnaround times by showing how long vehicles actually spend at each site, rather than how long you expect them to spend.
Comparing arrival and departure activity over time highlights locations where turnaround times are consistently longer than planned. That gives fleet managers a factual basis to:
- Review the scheduling assumptions built into job planning
- Adjust how much time is allowed for specific sites
- Raise loading processes or dock access with the sites that need it
2. Can geofence data support demurrage and delay queries?
Yes. Geofence data provides a consistent reference point for demurrage and delay discussions by showing when a vehicle entered a location, when it left and how long it remained there.
Waiting time becomes costly when vehicles are held beyond an agreed loading or unloading window. Without reliable records, reviewing those delays often means relying on driver recollections, phone calls or manually recorded times, which are easy to dispute.
Geofence records don't determine whether a demurrage charge applies. That depends on the agreement between you and your customer. What they do provide is a clearer, more consistent record of site activity to support the conversation.
3. How do you confirm a truck attended a pickup or delivery site?
You can confirm a truck attended a site by checking its geofence entry and exit records for that location. It answers the simple question behind many delivery queries: did the truck attend the site, and when?
Geofence records can verify visits to customer locations, distribution centres and depots, which is useful when:
- A customer queries whether a pickup or delivery took place
- You're investigating an unexpected delay
- You need to confirm activity across multiple jobs at once
Geofence data doesn't replace proof of delivery documentation. It adds valuable supporting information alongside it.
4. How can geofence reports reveal patterns across a fleet?
Geofence reports reveal patterns by letting you review site activity over weeks and months rather than one visit at a time. One long site visit might not be unusual. Repeated delays at the same location tell a different story.
Historical geofence activity shows which sites regularly hold vehicles longer than expected. That supports conversations about delivery windows, resource planning and operational efficiency. Combined with other fleet information in V-DAQ, it also gives a broader view of how vehicles are being used across the operation.
5. Can you review site activity if a geofence wasn't already set up?
Yes. With V-DAQ's cloud-based geofences, you can create a geofence around a location and apply it to available historical tracking data.
For example, a customer might question how long a truck spent at their distribution centre three weeks ago. Even if you weren't monitoring that location at the time, you can go back and review the vehicle's previous activity.
This is useful for investigating historical delays, responding to customer queries and identifying sites that may need closer attention.
What does V-DAQ's Geofence Activity Report show?
V-DAQ's Geofence Activity Report brings the information behind all five of these uses into a single view:
Rather than reviewing individual vehicle movements in isolation, operators can see what's happening across the locations they visit and the vehicles they operate.
Frequently Asked Questions
Start by reviewing time on site at the locations your vehicles visit most. A geofence report shows when each vehicle arrived, when it left and how long it stayed, which makes it easier to spot sites where vehicles regularly spend longer than planned.
Time on site is the length of time a vehicle spends inside a defined location, measured from geofence entry to geofence exit. It's sometimes called dwell time and is commonly used to review turnaround times and delays at depots, distribution centres and customer sites.
Geofence data can support a demurrage discussion by showing when a vehicle arrived, when it left and how long it was on site. It doesn't decide whether a charge applies, which depends on the agreement between the operator and the customer.
Stop time is how long a vehicle was stationary. Idle time is how long the engine was running while the vehicle was stopped. Looking at both within a geofence helps show how vehicles spend their time on site.
V-DAQ's Geofence Activity Report includes geofence entry and exit events, time on site, stop and idle time, and maximum speed within a geofence. For customers using supported Smart OBM configurations, payload information provides additional context.
Ready to see where your time goes?
Finding where your fleet is losing time doesn't always need more technology. Often it starts with making better use of the information your vehicles already generate every day.
Whether you're reviewing turnaround times, investigating a delay or confirming a customer site visit, the Geofence Activity Report makes those conversations easier.
There's more to a stop than a location. It's what you can learn from it that matters.